Electrify Chicago
An independent tool for viewing City of Chicago building data
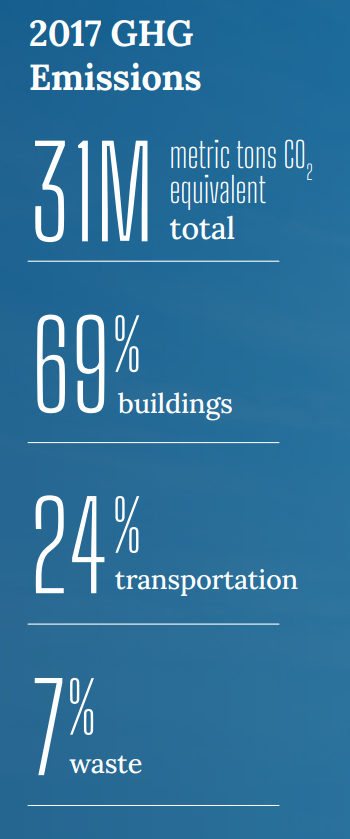
According to the
2022 Chicago Climate Action Plan ,
69% of Chicago's emissions come from buildings, making
building emissions our biggest challenge and our biggest opportunity as a city
to tackle climate change. At Electrify Chicago, we showcase building performance using
publicly available data supplemented by community-submitted photographs and building
owners.
,
69% of Chicago's emissions come from buildings, making
building emissions our biggest challenge and our biggest opportunity as a city
to tackle climate change. At Electrify Chicago, we showcase building performance using
publicly available data supplemented by community-submitted photographs and building
owners.
Start by looking at Chicago's buildings with the highest greenhouse gas intensity i.e. emissions per square foot. Large, efficient, buildings can perform much better than very inefficient small buildings on this metric.
New Article
📰 $30 Million In Missed Fines
The City Of Chicago failed to collect $30 million in potential fines from the building benchmarking ordinance, reducing transparency and accountability.
Legislative update! 🎉
As of late January 2024, legislation is being introduced to require new use more efficient forms of water and space heating, via the Clean And Affordable Buildings Ordinance (CABO), which will reduce the number of highly polluting and inefficient buildings that end up on this site.
If you're in Chicago,
write to your alderman to support the CABO!
Chicago Buildings by Greenhouse Gas Intensity
Note: Data includes large Chicago buildings with data from 2022, unless explicitly stated otherwise.
Note: This data only includes buildings whose emissions are reported
under the
Chicago Energy Benchmarking Ordinance. According to the City “As of 2016,
this list includes all commercial, institutional, and residential buildings larger than
50,000 square feet.” This dataset is also then filtered to only buildings with
reported emissions > 1,000 metric tons CO2 equivalent.
The latest year of data is from 2022, but we update the site regularly when new data is available, and some buildings may have failed to report that year, and only have older data available.
| Property Name / address | Primary Property Type |
Greenhouse Gas Intensity (kg CO2 eq./sqft) |
Total Greenhouse Emissions (metric tons CO2 eq.) |
|---|---|---|---|
|
Cummings Life Science Center
🕰️
920 E 58th St
| Laboratory | 45.3 kg/sqft | 7,816 tons |
|
Whole Foods KBS
🚨
1550 N Kingsbury St
| Supermarket/Grocery Store | 45.0 kg/sqft #8 Highest
| 3,368 tons
Highest 11%
|
|
SBRI
🕰️
5812 S Ellis Ave
| Laboratory | 43.7 kg/sqft | 9,374 tons |
|
Armour
🕰️
950 E 59TH
| Laboratory | 43.7 kg/sqft | 2,834 tons |
|
KCBD
🕰️
900 E. 57th St
| Laboratory | 42.9 kg/sqft | 16,175 tons |
|
William Eckhardt Research Center
🚨
📷
(UChicago)
5640 S ELLIS AVE
| Laboratory | 40.9 kg/sqft #9 Highest
| 11,639 tons
Highest 2%
|
|
Peck
🕰️
5821 S Drexel Ave
| Laboratory | 40.4 kg/sqft | 5,044 tons |
|
Gordon Center for Integrative Science (GCIS)
🚨
📷
(UChicago)
929 E 57th St
| Laboratory | 40.0 kg/sqft #10 Highest
| 19,164 tons #16 Highest
|
|
MetraMarket of Chicago
🕰️
118 N. Canal Street
| Mixed Use Property | 37.4 kg/sqft | 2,350 tons |
|
McGowan North
🚩
(DePaul)
2325 N Clifton Ave
| College/University | 36.8 kg/sqft #11 Highest
| 2,063 tons
Highest 22%
|
|
Pete's Pulaski
🚩
4343 S Pulaski Rd
| Supermarket/Grocery Store | 33.4 kg/sqft #12 Highest
| 1,869 tons
Highest 25%
|
|
Whole Foods
🚩
3201 N ASHLAND AVE
| Supermarket/Grocery Store | 32.8 kg/sqft #13 Highest
| 2,692 tons
Highest 16%
|
|
320 E Superior Street
🚩
(Northwestern)
320 E Superior Street
| Laboratory | 32.5 kg/sqft #14 Highest
| 6,075 tons
Highest 5%
|
|
Carlson
🕰️
949 E 58th St
| Laboratory | 32.4 kg/sqft | 2,169 tons |
|
Hinds Laboratory
🚩
📷
(UChicago)
5734 S Ellis Ave
| Laboratory | 32.3 kg/sqft #15 Highest
| 4,237 tons
Highest 9%
|
Data Source:
Chicago Energy Benchmarking Data