Electrify Chicago
An independent tool for viewing City of Chicago building data
According to the
2022 Chicago Climate Action Plan,
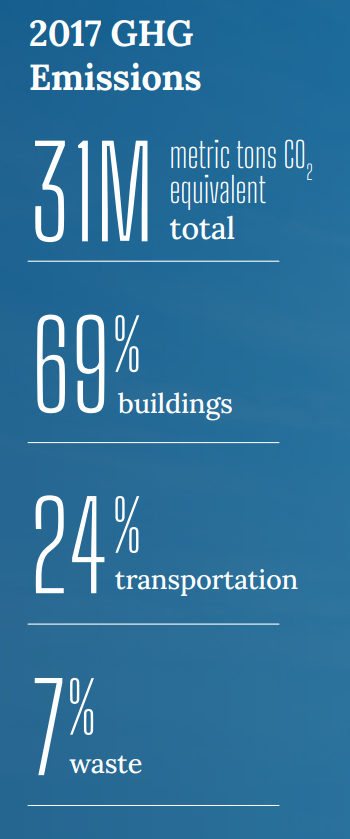
69% of Chicago's emissions come from buildings, making
building emissions our biggest challenge and our biggest opportunity as a city
to tackle climate change. At Electrify Chicago, we showcase building performance using
publicly available data supplemented by community-submitted photographs and building
owners.
Start by looking at Chicago's buildings with the highest greenhouse gas intensity i.e. emissions per square foot. Large, efficient, buildings can perform much better than very inefficient small buildings on this metric.
New Article
📰 $30 Million In Missed Fines
The City Of Chicago failed to collect $30 million in potential fines from the building benchmarking ordinance, reducing transparency and accountability.
Legislative update! 🎉
As of late January 2024, legislation is being introduced to require new use more efficient forms of water and space heating, via the Clean And Affordable Buildings Ordinance (CABO), which will reduce the number of highly polluting and inefficient buildings that end up on this site.
If you're in Chicago,
write to your alderman to support the CABO!
Chicago Buildings by Greenhouse Gas Intensity
Note: Data includes large Chicago buildings with data from 2022, unless explicitly stated otherwise.
Note: This data only includes buildings whose emissions are reported
under the
Chicago Energy Benchmarking Ordinance. According to the City “As of 2016,
this list includes all commercial, institutional, and residential buildings larger than
50,000 square feet.” This dataset is also then filtered to only buildings with
reported emissions > 1,000 metric tons CO2 equivalent.
The latest year of data is from 2022, but we update the site regularly when new data is available, and some buildings may have failed to report that year, and only have older data available.
| Property Name / address | Primary Property Type |
Greenhouse Gas Intensity (kg CO2 eq./sqft) |
Total Greenhouse Emissions (metric tons CO2 eq.) |
|---|---|---|---|
|
Conservancy at North Park Condo I
3900 W BRYN MAWR AVE
| Multifamily Housing | 3.6 kg/sqft
Lowest 6%
| 218 tons
Lowest 3%
|
|
Frances Larry Apartments
824 832 E 53rd St
| Multifamily Housing | 3.6 kg/sqft
Lowest 6%
| 223 tons
Lowest 3%
|
|
StThomastheApostle_School
🕰️
5472 S Kimbark Ave
| K-12 School | 3.6 kg/sqft | 227 tons |
|
Herzl -CPS
🕰️
(CPS)
3711 W Douglas Blvd
| K-12 School | 3.6 kg/sqft | 519 tons |
|
Hanson Park -CPS
(CPS)
2301 N Central Ave
| K-12 School | 3.6 kg/sqft
Lowest 6%
| 481 tons
Lowest 25%
|
|
Reinberg Elementary -CPS
(CPS)
3425 N Major Ave
| K-12 School | 3.6 kg/sqft
Lowest 6%
| 600 tons
Lowest 33%
|
|
Wentworth Gardens
(CHA)
3770 S Wentworth Ave
| Multifamily Housing | 3.6 kg/sqft
Lowest 6%
| 2,991 tons
Highest 14%
|
|
The Metropolitan Place Condominium Association
🕰️
130 S Canal St
| Multifamily Housing | 3.6 kg/sqft | 2,046 tons |
|
Bennett Brothers Building (Hartman Building)
30 32 E ADAMS ST
| Office | 3.6 kg/sqft
Lowest 6%
| 635 tons
Lowest 36%
|
|
3740 N PINE GROVE AVE
🏆
3740 N PINE GROVE AVE
| Multifamily Housing | 3.6 kg/sqft
Lowest 6%
| 192 tons
Lowest 2%
|
|
3940 W BRYN MAWR AVE
3940 W BRYN MAWR AVE
| Multifamily Housing | 3.6 kg/sqft
Lowest 6%
| 220 tons
Lowest 3%
|
|
401 465 E Illinois St
401 465 E Illinois St
| Multifamily Housing | 3.6 kg/sqft
Lowest 6%
| 1,440 tons
Highest 33%
|
|
Chicago & Kedzie Plaza
800 N Kedzie Ave
| Strip Mall | 3.6 kg/sqft
Lowest 6%
| 547 tons
Lowest 30%
|
|
Printers Row Lofts
722 740 S FINANCIAL PL
| Multifamily Housing | 3.6 kg/sqft
Lowest 6%
| 711 tons
Lowest 41%
|
|
2001 S CALUMET AVE
2001 S CALUMET AVE
| Multifamily Housing | 3.6 kg/sqft
Lowest 6%
| 504 tons
Lowest 27%
|
Data Source:
Chicago Energy Benchmarking Data
