Electrify Chicago
An independent tool for viewing City of Chicago building data
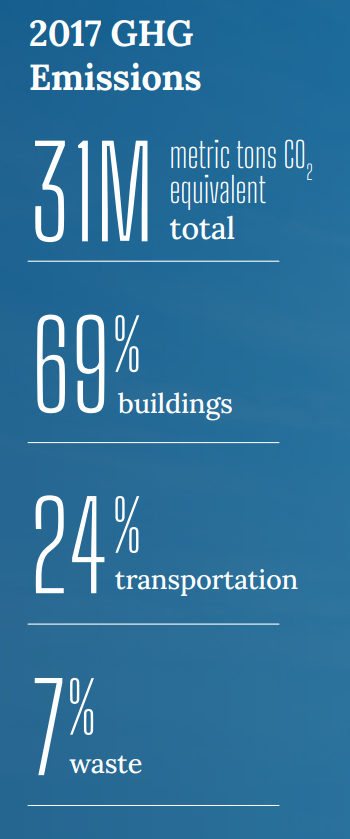
According to the
2022 Chicago Climate Action Plan ,
69% of Chicago's emissions come from buildings, making
building emissions our biggest challenge and our biggest opportunity as a city
to tackle climate change. At Electrify Chicago, we showcase building performance using
publicly available data supplemented by community-submitted photographs and building
owners.
,
69% of Chicago's emissions come from buildings, making
building emissions our biggest challenge and our biggest opportunity as a city
to tackle climate change. At Electrify Chicago, we showcase building performance using
publicly available data supplemented by community-submitted photographs and building
owners.
Start by looking at Chicago's buildings with the highest greenhouse gas intensity i.e. emissions per square foot. Large, efficient, buildings can perform much better than very inefficient small buildings on this metric.
New Article
📰 $30 Million In Missed Fines
The City Of Chicago failed to collect $30 million in potential fines from the building benchmarking ordinance, reducing transparency and accountability.
Legislative update! 🎉
As of late January 2024, legislation is being introduced to require new use more efficient forms of water and space heating, via the Clean And Affordable Buildings Ordinance (CABO), which will reduce the number of highly polluting and inefficient buildings that end up on this site.
If you're in Chicago,
write to your alderman to support the CABO!
Chicago Buildings by Greenhouse Gas Intensity
Note: Data includes large Chicago buildings with data from 2022, unless explicitly stated otherwise.
Note: This data only includes buildings whose emissions are reported
under the
Chicago Energy Benchmarking Ordinance. According to the City “As of 2016,
this list includes all commercial, institutional, and residential buildings larger than
50,000 square feet.” This dataset is also then filtered to only buildings with
reported emissions > 1,000 metric tons CO2 equivalent.
The latest year of data is from 2022, but we update the site regularly when new data is available, and some buildings may have failed to report that year, and only have older data available.
| Property Name / address | Primary Property Type |
Greenhouse Gas Intensity (kg CO2 eq./sqft) |
Total Greenhouse Emissions (metric tons CO2 eq.) |
|---|---|---|---|
|
Infinite Chicago
🏆
28 E Jackson Blvd
| Multifamily Housing | 1.3 kg/sqft
#11 Lowest in Chicago*
| 286 tons
Lowest 7%
|
|
Cassidy Tire
🕰️
344 N Canal St
| Repair Services (Vehicle, Shoe, Locksmith, etc.) | 1.3 kg/sqft | 103 tons |
|
Franklin Blvd Partners, LLC
🕰️
3515 W Franklin Blvd
| Multifamily Housing | 1.3 kg/sqft | 119 tons |
|
MAYNARD AT ELAINE PLACE - CLK
🕰️
3426 N Elaine Place
| Multifamily Housing | 1.2 kg/sqft | 368 tons |
|
33 S Ashland Ave
🏆
33 S Ashland Ave
| Multifamily Housing | 1.2 kg/sqft
#10 Lowest in Chicago*
| 79 tons
#4 Lowest in Chicago*
|
|
Dream Town
🕰️
4032 W. Madison St
| Office | 1.2 kg/sqft | 103 tons |
|
104 S LAFLIN ST
🏆
104 S LAFLIN ST
| Multifamily Housing | 1.1 kg/sqft
#8 Lowest in Chicago*
| 70 tons
#3 Lowest in Chicago*
|
|
2130-2140 W Fulton
🕰️
2130 2140 W Fulton St
| Office | 1.1 kg/sqft | 57 tons |
|
Prodigy Wood-CPS
🕰️
(CPS)
4511 S EVANS AVE
| K-12 School | 1.1 kg/sqft | 157 tons |
|
Cabrini Rowhomes
🏆
(CHA)
900 N Hudson
| Multifamily Housing | 1.1 kg/sqft
#8 Lowest in Chicago*
| 819 tons
Lowest 47%
|
|
11414 S HALSTED ST
🕰️
11414 S HALSTED ST
| Supermarket/Grocery Store | 1.0 kg/sqft | 66 tons |
|
2019 - 6900 S Crandon
🕰️
6900 S. Crandon Ave
| Senior Care Community | 1.0 kg/sqft | 127 tons |
|
Morgan Park United Methodist Church
🕰️
11030 S. Longwood Dr
| Worship Facility | 0.9 kg/sqft | 62 tons |
|
800 Clark
🏆
800 810 N CLARK ST
| Multifamily Housing | 0.9 kg/sqft
#7 Lowest in Chicago*
| 858 tons
Lowest 49%
|
|
Devon Executive
🕰️
4001 W Devon Ave
| Office | 0.9 kg/sqft | 47 tons |
Data Source:
Chicago Energy Benchmarking Data